어떻게 Excel에서 R-제곱 찾는 방법은? 사용 (RSQ) 기능
Excel에서 r 제곱은 무엇입니까?
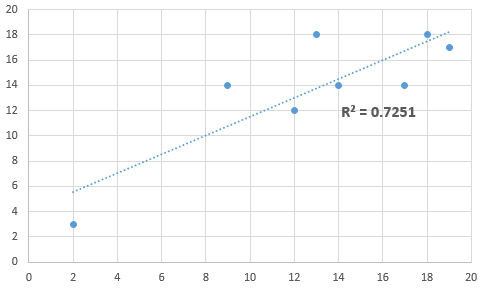
데이터 세트의 R-Squired는 데이터가 회귀선에 얼마나 잘 맞는지 알려줍니다. 회귀선에서 데이터 포인트의 적합도를 알려주는 데 사용됩니다. ‘link : / statistical-formulas-how-to-find-correlation-coefficient-in-excel [상관 계수]’의 제곱 값입니다. 결정 계수라고도합니다. 이것은 종종`link : / tips-regression-data-analysis-tool [regression analysis]`, ANOVA 등 분석에 사용됩니다. 엑셀에서 요구되는 공식은`link : / tips-regression-data-analysis-tool [RSQ function]`입니다. 이 튜토리얼에서는 RSQ 함수를 사용하여 Excel에서 제곱 계산하는 방법을 배웁니다.
 How to calculate Rsquare in excel?* As I told you, Excel provides RSQ function to easily get the R-squired of the sample data set.
구문 :
|
=RSQ(Known_ys, Known_xs) |
Known_ys : * 종속 변수.
Known_xs : * 독립 변수.
참고 : * x와 y의 변수 개수는 같아야합니다.
그렇지 않으면 #NA 오류가 발생합니다.
이제 우리가 이해할 수 있도록 RSQ 함수의 예를 들어 보겠습니다.
Excel의 R-Square 예
여기에 샘플 데이터 세트가 있습니다. A2 : A9 범위에는 know_xs가 있고 B2 : B9 범위에는 known_ys가 있습니다.
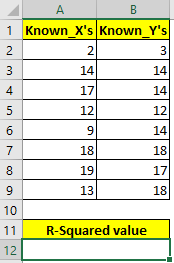
이제 RSQ 함수를 사용하여 Excel에서 R2를 찾습니다. 이 수식을 A12 셀에 씁니다.
|
=RSQ(B2:B9,A2:A9) |
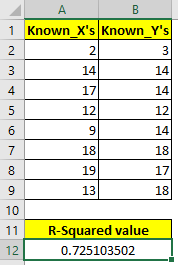
Enter 버튼을 누르면 약 72 % 인 0.725103502 값이 표시됩니다.
R- 제곱을 해석하는 방법
R- 제곱 값은 항상 0.0-1.0 범위에 속하거나 0 %에서 100 %까지 말할 수 있습니다. 0 % r- 제곱 값은 회귀선에서 데이터 포인트가 떨어질 것이라는 보장이 없음을 나타냅니다. 100 % r- 제곱 값은 회귀선에서 데이터 포인트가 떨어질 가능성이 100 %임을 나타냅니다.
(이를 보장하기 위해 수행되는 다른 요인과 분석도 있습니다.
우리의 경우 72 %의 적합도가 있습니다.
R을 계산하는 또 다른 방법 -Excel의 제곱
기사의 시작 부분에서 R 제곱 값은 ‘link : / statistical-formulas-how-to-find-correlation-coefficient-in-excel [ 상관 계수]`. 따라서이 공식을 작성하면 RSQ 함수와 동일한 결과가 반환됩니다.
여기에서`link : / statistical-formulas-how-to-find-correlation- 계수-인-엑셀 [CORREL 함수]`는 상관 계수를 계산하는 데 사용되며 상관 계수의 제곱을 얻기 위해이를`link : / mathematical-functions-excel-power-function [POWER function]`으로 캡슐화합니다.
충분히 설명이 되었기를 바랍니다. r-square를 더 이해하려면`link : / tips-regression-data-analysis-tool [regression analysis]`in excel을 읽어보세요. 더 많은 질의는 주석을 사용하세요 sec 아래에 tion.
관련 기사 :
link : / statistical-formulas-how-to-find-correlation-coefficient-in-excel [Excel에서 상관 계수를 찾는 방법]
link : / statistical-formulas-calculate-intercept-in-excel [Excel에서 INTERCEPT 계산]
link : / statistical-formulas-calculating-slope-in-excel [Excel에서 SLOPE 계산]
link : / statistical-formulas-how-to-use-excel-normdist-function [Excel NORMDIST 함수 사용 방법]
link : / tips-how-to-create-a-pareto-chart-in-microsoft-excel [파레토 차트 및 분석]
인기 기사 :
link : / keyboard-formula-shortcuts-50-excel-shortcuts-to-increase-your-productivity [50 Excel 단축키로 생산성 향상]
link : / formulas-and-functions-introduction-of-vlookup-function [Excel의 VLOOKUP 함수]
link : / tips-countif-in-microsoft-excel [Excel 2016의 COUNTIF]
link : / excel-formula-and-function-excel-sumif-function [Excel에서 SUMIF 함수 사용 방법]